Basics of Google Trends: Knowing that searches for “flower shops” spike between November and December can help small business owners feel more confident in planning seasonal marketing, making them feel empowered to act on data.
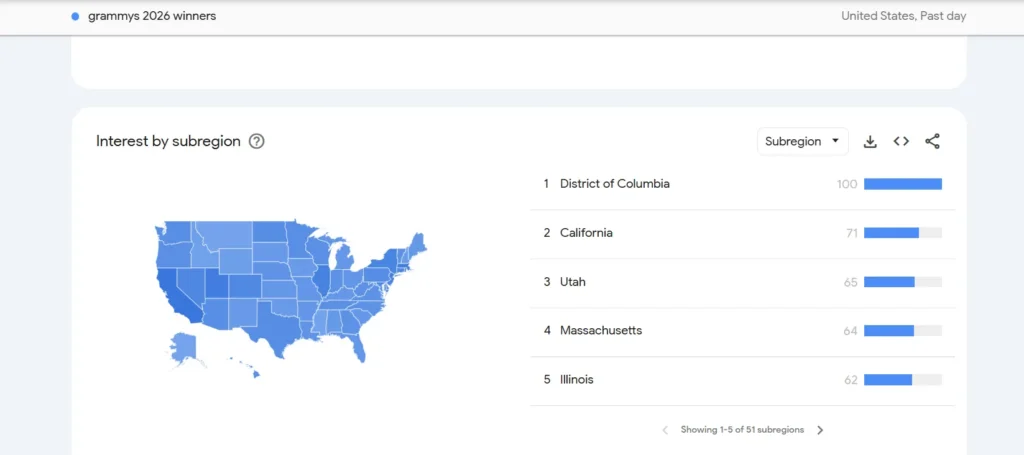
Users of Google Trends can view search interest data on a map in list view, with results separated by area or nation. The tool’s user interface allows simultaneous comparison of up to 5 topics, which helps in keyword research and understanding competition. It’s also important to remember that Google Trends’ findings don’t always align with those of AdWords and other Google products.
The tool also has a handy feature that shows similar questions and discussions. Businesses may learn a lot from visualizing trending themes, which can guide content strategy and product selection decisions. If, for instance, you see that interest in gold earrings is rising, you could decide to stock more of these earrings in your shop.
By displaying day-to-day fluctuations in search volume, Google Trends simplifies the analysis of search data for businesses. This allows them to look at trends over a longer period to get a more accurate sense of their growth and to target better their marketing efforts to particular keywords or specific times for publication and promotion.
What is Google Trends?
Google Trends is a free service that uses line graphs to demonstrate the growth and decline in popularity of a specific search term or subject over time. These graphs allow you to examine peak and trough times and search volume by country.
The ability to compare phrases like “automobiles vs. fashion” can inspire digital marketers to feel more creative and motivated, encouraging them to confidently explore new content ideas and strategies.
When using Google Trends, remember that the line graph shows an index from 0 to 100 indicating relative popularity, not actual search traffic. This distinction helps you interpret the data accurately and avoid overestimating search volume.
Altering the time frame to see interest fluctuations over hours, days, or years can help content creators feel more prepared and strategic, giving them confidence in planning content around peak interest periods.
Discover fresh keyword opportunities and use them to guide your online marketing using data from Google Trends. Awareness of trends may help you avoid wasting time and money on ineffective marketing initiatives, and knowing when interest in a topic increases can help you provide content at the optimal time.
How Google Trends Works For Digital Marketers
To use Google Trends effectively for digital marketing objectives, you, as a digital marketer, must have a solid understanding of how the platform works. Knowing how Google measures and displays search queries on its results pages can help you better evaluate trends and discover how to make use of Google’s Trend Tool to locate untapped market niches.
This graph, depicting its rising popularity over time, will be based on Google’s daily search data. The X-axis will represent time, while the Y-axis will have a numerical scale from 0 to 100. The graph will show peaks where interest is high and valleys where it is low. Google’s search engine handles billions of queries daily, which serve as the basis for these trends.
A rising trend in search volume after normalizing, anonymizing, classifying, and aggregating this data indicates growing interest, whereas a falling trend indicates waning interest.
Using Google Trends to detect seasonal patterns in your target keywords can be highly instructive. Retailers and travel companies, for example, can time their marketing campaigns to coincide with peak interest periods, optimizing sales and engagement throughout the year.
Exploring Your Own Topics on Google Trends
Topic Exploration: If you’re a small company owner interested in expanding into new areas or capitalizing on seasonal patterns, Google Patterns may offer you essential data to help you do so. This tool’s data helps plan your company’s development and expansion, from investigating local search patterns to comparing phrases against rivals.
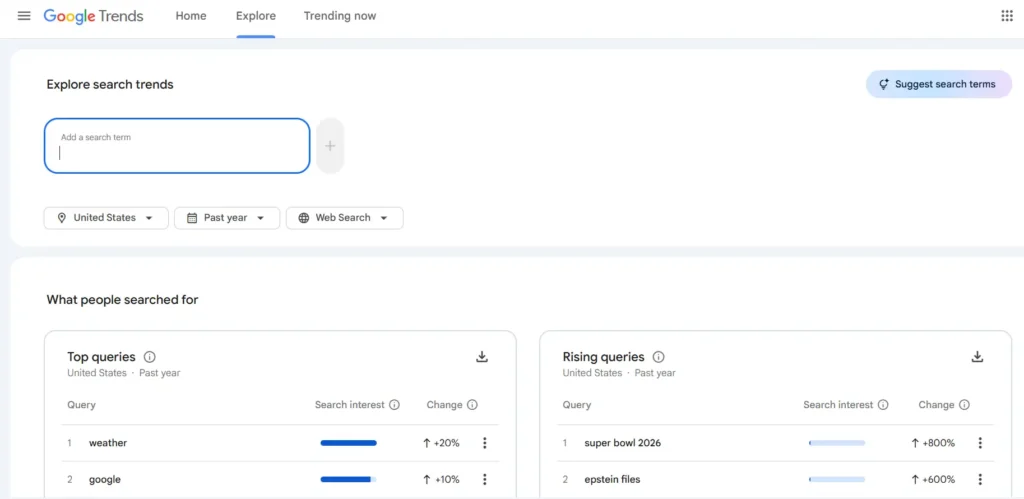
Use the Google Trends Explore function to compare up to five search terms or regions simultaneously. This helps you identify emerging niches, understand regional interests, and refine your content or product strategies based on real-time data.
If you search for “how to cut your own hair,” for example, you could see a brief uptick in interest, but if you search over several months or even years, you can determine whether or not the trend is ongoing.
Identifying new product categories, optimizing current pages for high season, and renaming existing pages are all possible thanks to the Related Topics and Queries capabilities.
Selecting a Topic in Google Trends
If you’re having trouble deciding on keywords for your company, Google Trends may help immensely. This tool helps eliminate external influences on search results, such as population density, by normalizing search volume data to provide relative popularity based on the number of searches across the chosen geographies and periods.
You may tailor your search depending on where you are in the world, what kind of user you are, what you’re looking for in the news, what you want to buy, and even what you saw on YouTube. Instructions on interpreting the site’s graphs and making your own timelines are also available.
Use this tool to determine when a topic is most popular and what kinds of material or items might appeal to its audience at that time. Furthermore, this can help avoid the resurgence of swiftly fading trends like fidget spinners; if they start rising again after being out for some time, you can divert your resources elsewhere.
Users may also use Google Trends to compare two topics simultaneously, which can be helpful when brainstorming new product or content ideas. It is essential to target specific cities or areas with SEO or content marketing, and you can do so by narrowing your search results to the geographic area you want to reach.
Reading the Interest Over Time Graph in Google Trends
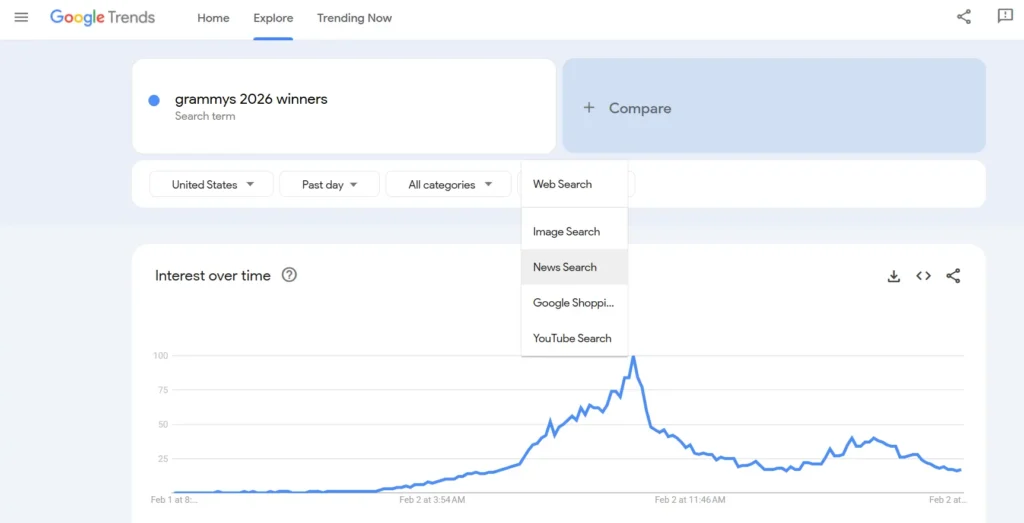
The Interest Over Time graph in Google Trends is a valuable tool for measuring people’s interest level in a specific topic or phrase over time. This may help you understand the interest in your products and services throughout the year. For example, if their popularity spikes in the winter, it could make sense to focus marketing and stock management efforts on that time of year.
Businesses selling their wares in multiple locations will find Trends’ regional breakdown of the most-searched phrases and subjects an essential resource. For instance, geotargeted ads might prove fruitful if “gold earrings” is a popular search term in New York.
As a powerful SEO tool, Google Trends lets you monitor keyword movements in any sector or field. Finding the right keywords for your target audience and your rivals’ strategies is a huge assist.
To prevent outliers like cities with disproportionately more people from dominating search results due to higher volumes, Google Trends normalizes search volume by dividing each search term by its total search count over time and area. This helps eliminate anomalies in which certain cities appear higher in search results simply because more people search for those terms.
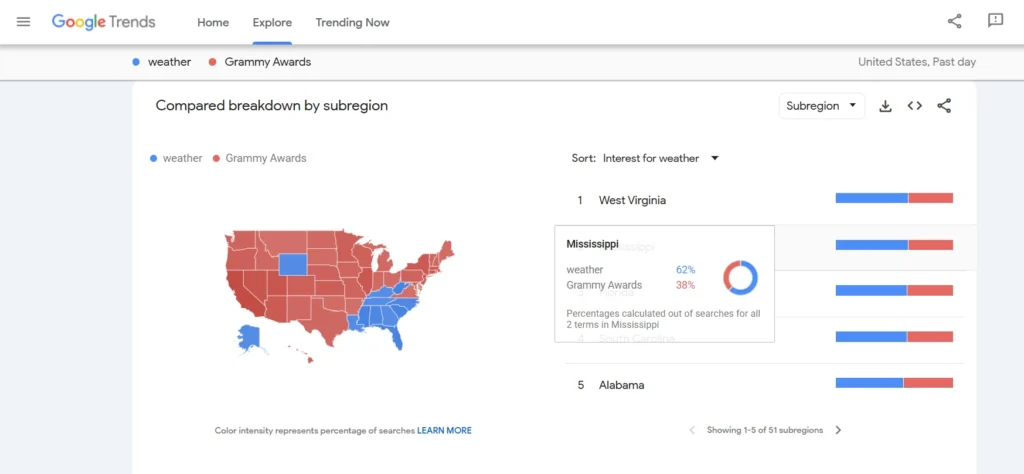
Learn the Basics of Location Data With Google Trends
Google Trends is a free service that tracks the popularity of search phrases globally and over time. Marketers and company owners may use the platform’s search data to see how popular their products, services, or content are with their target audience and when those searches are most popular.
Because Trends normalizes search data to make comparisons easier, a high value of 100 indicates a large number of searches. In contrast, a lower value, although still indicative of significant interest, means a relatively small number of searches. You can get a more detailed look at search patterns and uncover fascinating trends that weren’t immediately obvious when examining global datasets by filtering results by region, time, and category in Trends.
When used with other keyword research tools, Google Trends’ unique zoom feature can help local companies quickly gain insights into what their target consumers are searching for in their area.
Marketers may benefit from Google Trends’ seasonal search data, such as the annual surge in interest for “school uniforms” in late July and early August.
What Factors Does Google Trends Use to Determine Which Topics Are Trending
Google Trends can assess and estimate general interest in a topic over time using anonymized search data from Google Search, News, Images, Shopping, and YouTube. So, this tool can assist with more than just standard keyword research; for example, if you run a plumbing company in Phoenix, you might find that video tutorials perform better than text-based articles on your website.
Dialectical words and seasonality are only two examples of how these tools consider geographical differences. To ensure that higher-volume cities don’t skew the results, the tool splits them by the total number of searches in your region over time.
Note, however, that Google Trends is not a crystal ball, and a rising line may not always indicate a general increase in interest.
How to Read and Understand Top and Rising Searches in Google Trends
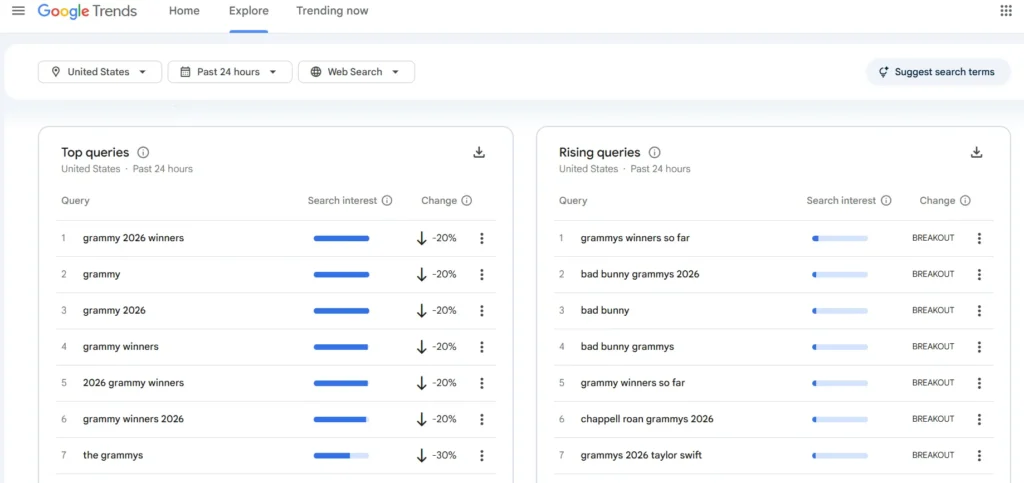
Google Trends is a free service that provides a historical view of global and regional interest in a particular search term or topic. As a result, Google Trends is a priceless tool for marketers and others seeking to gauge consumer interest and product demand.
When writing for a global audience, Google Trends’ ability to compare search volume across regions is invaluable. Seasonal trend tracking is an excellent way to organize content; for example, “Mother’s Day presents” searches peak in April.
Regular writers and those who write for business websites can benefit greatly from using Google Trends’ Top and Rising Searches data to plan and schedule articles that will draw readers back for more. With this information in hand, you may confidently write articles that will reach your target demographics.
When using Trends, you can see how popular certain search phrases are, with 100 indicating the highest level of popularity. It also provides a standardized scale that makes it easy to see which words are trending in search traffic over time and across space. Trends also highlight queries that have experienced a meteoric rise in popularity over a given period and geographic area.
What do “indexed” and “normalized” mean in Google Trends?
Indexing in Google Trends
Google Trends enables you to search for and analyze the relative popularity of queries or subjects over time and by region without providing exact search volume statistics.
The rising lines represent increased interest in the phrase across all search engines. You may also see “breakout” phrases that had significant increases in usage, as well as related searches.
Normalization in Google Trends
With Google Trends, you can see what people worldwide are searching for right now. Its raw data collection includes millions of daily queries, with no filtering.
To compare how popular different data points are, we may normalize them by dividing the total number of searches by the geographic region and period they cover.
Data excluded from the search in Google Trends
These data are excluded from the search in Google Trends:
- Search terms with low volume
- Duplicate searches
- Special characters

")


: Review, Price, Features, Battery & Camera Details")